A few months ago Tomek Paczkowski and I were trying to create some well defined bounded contexts out of a set of existing services. This was a classic situation of a start up that had grown and changed as they needed to and the engineers were struggling to extend their services because they didn’t know who was dependent on them and sometimes who they were dependent on in order for their service to keep doing what it was doing. In many cases engineers in different teams had no way of knowing what other team’s services were doing at all. There were a few cases where variable meant something different to Variable and this all needed to be uncovered if progress was going to be made.
It was decided that the best way to document services was to treat them as bounded contexts and discover what inbound data they were dependent on and what outbound data they produced and the rules that turned one into the other.
The organisation had done some Domain Driven Design work and was familiar with the terminology, which meant engineers were familiar with the context. The difficult thing was creating a process so Tomek and I didn’t have to visit every team and interrogate each of them and then to have to go back around when we found inconsistencies.
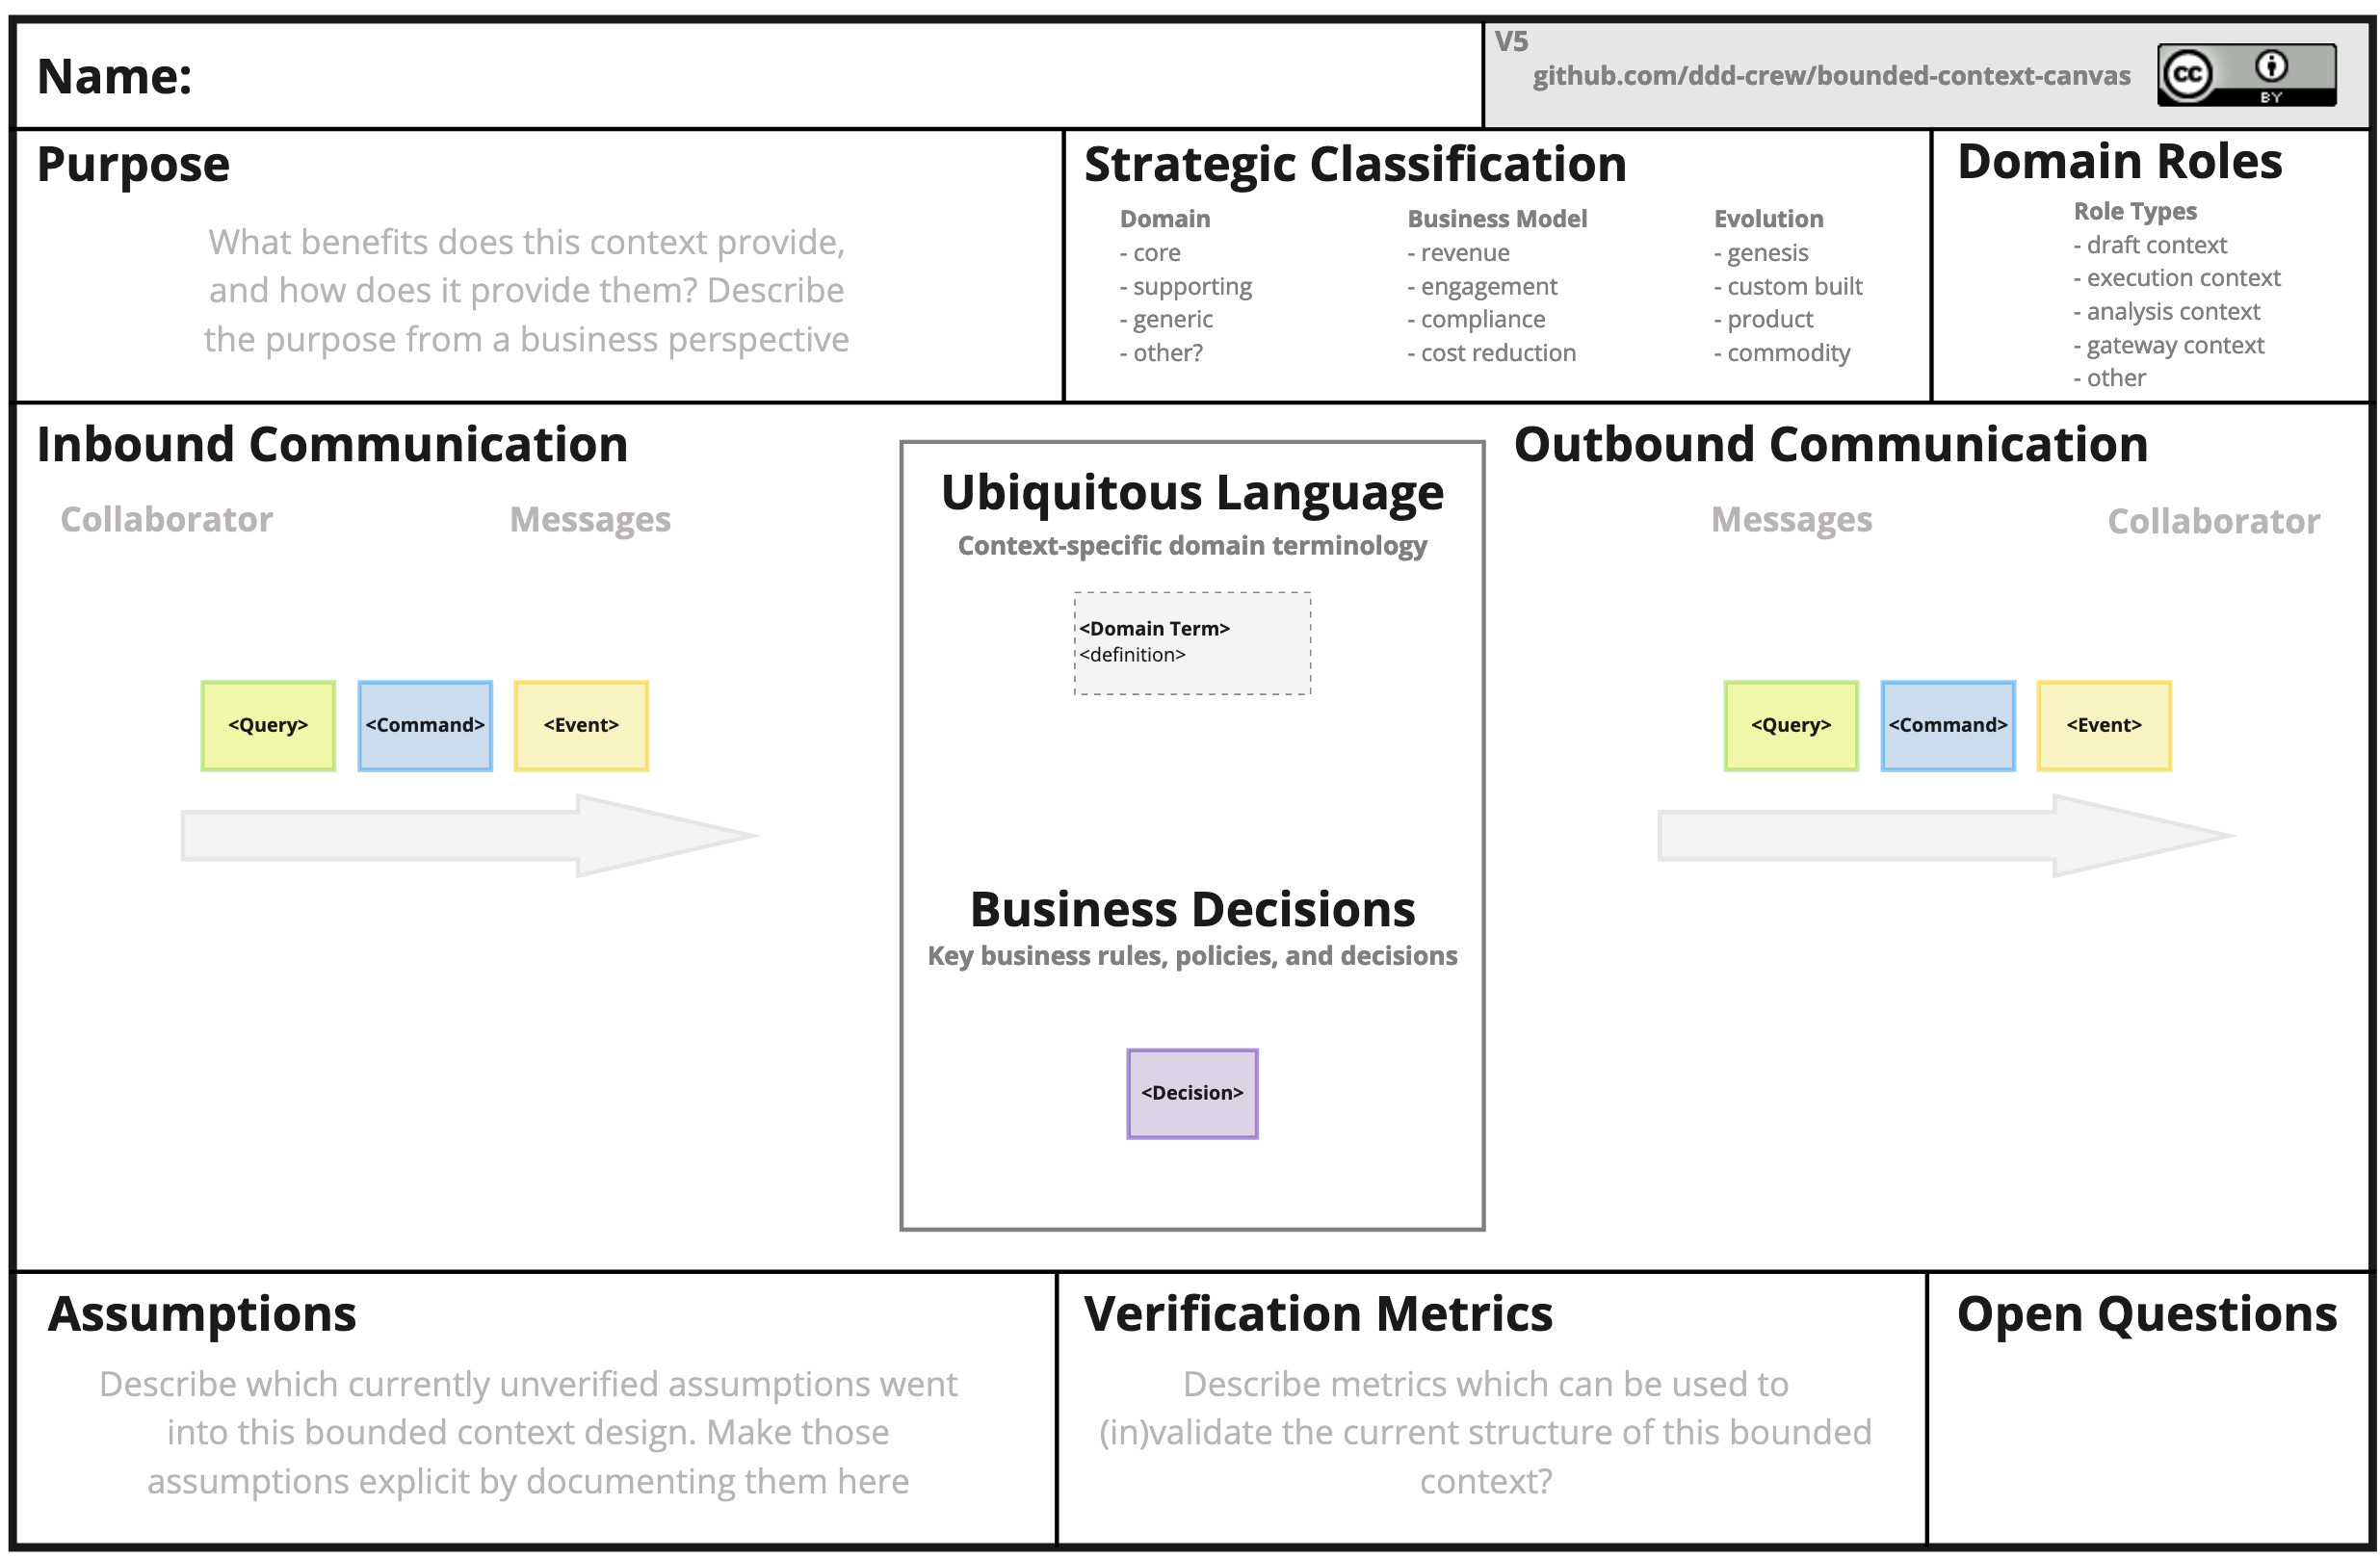
The organisation used Notion for document management so Tomek and I created a bounded context canvas for a service, on a call with the engineers who ran the service to try and extract the details. We used the ddd-crew’s Bounded Context Canvas for inspiration.
We used Cunningham’s Law* to get the engineers to actively contribute and eventually take over the exercise and populate the information for themselves. This not only worked beautifully but it took us less than an hour to get a good first draft of each bounded context.
* “The best way to get the right answer on the Internet is not to ask a question; it’s to post the wrong answer.” – Howard G Cunningham
The DDD Crews Bounded Context Canvas template looks like this:
When we started the meeting Tomek shared his screen and he started building the template on the fly. In this first meeting we had some preconceptions about the service we were discussing so Tomek and I would make some suggestions about how we thought it worked. The team quickly got frustrated with us getting it wrong and they just started modifying the document with what was actually taking place. Less than an hour later we had fully documented the service well enough that we could now use the information to talk to one of the teams with a service upstream.
The next conversation went even faster than the first because we now had some documented facts, in a useful template and the second team could see what was expected of them. It worked really well! I’ve since used the approach in another, larger organisation with similar problems and it worked just as well again.
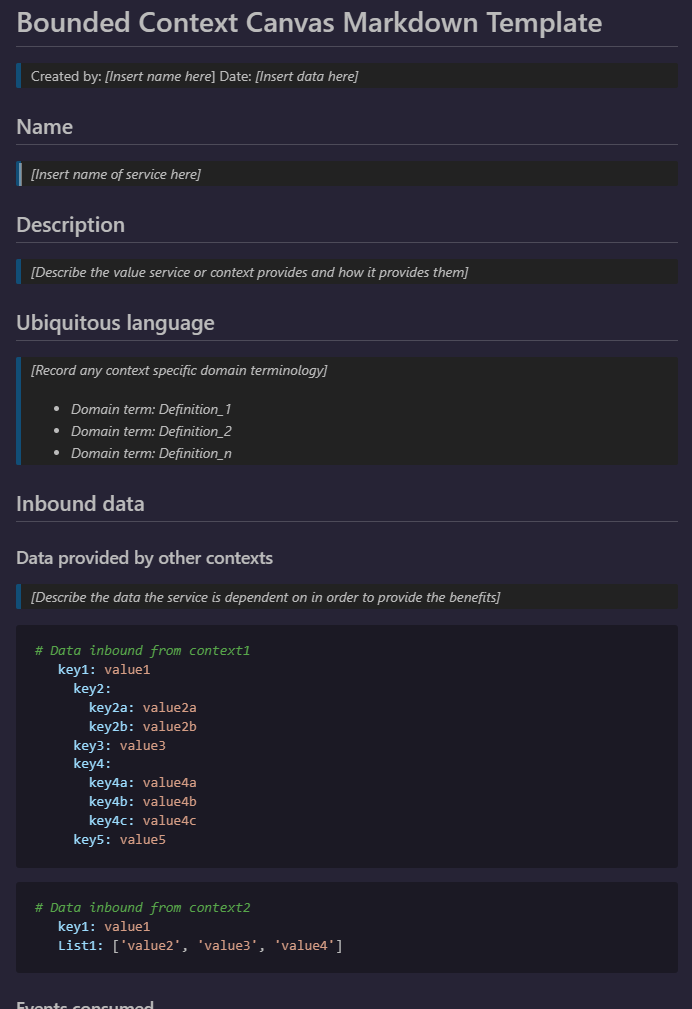
So if you want the template and a full README with descriptions about how to get the best from it you can check it out here:
A question I’m often asked is: “How do I measure the health and productivity of a product delivery team”. The question can cause a lot of stress as the people being considered often assume the person asking is trying to measure them by some objective measure and to compare one team to another this doesn’t lead to any useful conclusions but there are indicators that a team could use some help and these are the ones I use.
Before getting into the indicators I start by assessing some initial principles. If any of these aren’t true the chances of the team being healthy and productive are low:
Do the team have an appropriate level of responsibility, accountability and authority over what they are building?
Do the team have a good understanding of who they are providing solutions for and how well those solutions are working for those people?
Are the team working with tools, processes, systems and technologies that they want to be working on OR are they happy that they are part of an initiative that resolves whatever problems they might have with the tools, processes, systems and technologies they are working with.
If all those things are true I can start looking at some more objective measurements to get a sense of whether the team is doing good work. If they aren’t true we need to fix those things before we measure anything.
The measures I care most about are:
Time to onboard new developers
If it takes more than one or two days for a new team member to review part of a solution and contribute something useful to it then that is a sign that the systems or the solution is too complicated or poorly documented which is a sign of poor health.
DORA Metrics
Deployment Frequency
Lead time for changes
Mean time to recovery
Change failure rate
The DORA metrics are useful because if you attempt to game the metrics you still end up with a good result. If you game Deployment Frequency and release even ridiculously tiny changes like config variable changes you still force your pipeline to run quickly or your lead time for changes increases and you have to have good testing or your change failure rate increases.
Estimation metrics are useful for a team to have a view about itself but they aren’t of much use to anyone else. The characteristics of their burndown charts are a useful indicator that a team might need support.
If the burndown is flat and then drops off a cliff, there’s a clue that the team is not managing their work well or are not well informed about their requirements.
Large downward vertical drops indicate that the team is tackling work that is too large and might have been passing a story from week to week for too long. Large upward vertical inclines suggest the team has been tackling too large a piece of work and have suddenly discovered they need to break something down in several smaller stories. Neither of these things are necessarily bad but they are indicators that a leader might want to get closer to the team to see if they need help.
Conclusion
Those are the most important measures, once I’m happy with those I then focus on the items below.
You’ll notice that there is no attempt to measure productivity objectively. That’s because it’s unecessary and impossible in software engineering. If you object to the idea that measuring productivity is unecassary then you should read about Theory X and Theory Y. Software engineers are internally motivated they don’t need someone telling them they aren’t productive enough, they know when they’re being productive and they will tell you when they aren’t! If productivity is inadequate it will be because something isn’t right and the answer will be exposed by one of the measures detailed on this page. The reason objective productivity is impossible to measure is because no two software problems are ever exactly the same. Even if the problems seem identical there will be some external factor that will make it different. The difference might be as trivial as a minor version upgrade of a dependency or it could be something as major as a combination of browser upgrades, cloud system upgrades and a different team with different experience. Either way comparing two teams trying to solve the same problem is fruitless.
If all the principals mentioned above are true and you have the measures in place for the metrics I mentioned and something still isn’t right then continue to read the additional measures below that can help pinpoint precisely where the problem is:
Good understanding of their role and place in the strategy
Skip level 1:1s are a useful tool to determine if a team has a good understanding of the wider business strategy and how that has informed their product roadmap and the features they are building. If a team member can’t explain what they’re doing in the context of the business strategy there is a real chance that the team isn’t in a position to make good decisions about their solution.
How long PRs wait for review, or how many PRs are waiting for review.
Charting these metrics by team can be useful to identify when a team is overburdened or when a team is working on something they are struggling with. A platform team with a lot of PRs or a long-lead time for reviewing PRs could indicate they are overworked or it might indicate training needs in the teams consuming the platform.
Focus
If a team of six is tackling six stories simultaneously there is a chance that it isn’t a team it’s six individuals. There’s some nuance to this, if they break their stories down well and split an epic between them and act as reviewers for each other then it could be a healthy sign but more often than not it’s more healthy for a team to tackle one or two objectives at once and to work together on them.
Systems/Application scorecard
If a team’s systems and applications are meeting all the organisation’s security, compliance and engineering standards then the team is likely to be doing good work.
This solution was so successful the teams were actually motivated to race each other to be first to get all A’s or who could get the Spectre badge we offered for the first team to patch the Spectre and Meltdown bugs.
This scorecard should include the four golden signals.
These notes are lifted straight from the Google article linked above.
Latency
The time it takes to service a request. It’s important to distinguish between the latency of successful requests and the latency of failed requests. For example, an HTTP 500 error triggered due to loss of connection to a database or other critical backend might be served very quickly; however, as an HTTP 500 error indicates a failed request, factoring 500s into your overall latency might result in misleading calculations. On the other hand, a slow error is even worse than a fast error! Therefore, it’s important to track error latency, as opposed to just filtering out errors.
Traffic
A measure of how much demand is being placed on your system, measured in a high-level system-specific metric. For a web service, this measurement is usually HTTP requests per second, perhaps broken out by the nature of the requests (e.g., static versus dynamic content). For an audio streaming system, this measurement might focus on network I/O rate or concurrent sessions. For a key-value storage system, this measurement might be transactions and retrievals per second.
Errors
The rate of requests that fail, either explicitly (e.g., HTTP 500s), implicitly (for example, an HTTP 200 success response, but coupled with the wrong content), or by policy (for example, “If you committed to one-second response times, any request over one second is an error”). Where protocol response codes are insufficient to express all failure conditions, secondary (internal) protocols may be necessary to track partial failure modes. Monitoring these cases can be drastically different: catching HTTP 500s at your load balancer can do a decent job of catching all completely failed requests, while only end-to-end system tests can detect that you’re serving the wrong content.
Saturation
How “full” your service is. A measure of your system fraction, emphasizing the resources that are most constrained (e.g., in a memory-constrained system, show memory; in an I/O-constrained system, show I/O). Note that many systems degrade in performance before they achieve 100% utilization, so having a utilization target is essential.
…
Finally, saturation is also concerned with predictions of impending saturation, such as “It looks like your database will fill its hard drive in 4 hours.”
While Core Web Vitals are a web application performance metric they also provide a view into how well a team is able to observe, orient, decide and act (OODA) the speed of a team’s OODA loop is another insight into how healthy a team is. Each aspect of the OODA loop can provide insight into where a team might need help:
Observe: Does a team have access to the right signals? Do they even know how their app performs?
Orient: Is the team able to review those signals in context? Does the team know if their application performance is acceptable?
Decide: Can the team use the information they have in context to make decisions? Can the team make the difficult decisions necessary to balance their application requirements against Google’s expectations expressed in the Core Web Vitals?
Act: Having decided what to do can the team actually implement the change in a reasonable time frame?
The OODA loop is an essential component of the Lead time for changes in the DORA metrics.
Measurable improvements to business Outcomes
The ultimate purpose of a product delivery team is to achieve some desired business outcomes such as customer acquisition, or conversion. This isn’t always easy to measure but some attempt must be made to describe what success means for that team. If success is building a feature with no link to the reason why that feature is being built the team will inevitably get stuck on requirements and may be accused of gold-plating their solution.
Experimentation rate
The time taken for a team to design an experiment, agree the conditions for the experiment and time or results required for conclusion of the experiment and then generating insight is a useful metric to describe the health of a team, their understanding of their users and quality of their solution and the tools they have to manage it.
Retros
Team retrospectives are a good indicator of team health. I always tell my teams that I won’t attend their retros so they can feel free to criticise or comment on anything they want to and then I ask them to provide me with a summary of whatever they feel comfortable sharing. I can then use this to try and determine what issues might be impacting the team.
Team health checks
Team health checks have become quite popular recently and there are a few different solutions that are summarised quite nicely in this Medium article written by Philip Rogers
NPS is a useful tool but needs to be used sparingly, once a quarter is about as often as you can ask for an NPS score before people get frustrated with the process.
At the beginning of the year I contributed to an article Appdynamics put together called ‘The State of DevOps at the Start of 2017‘. I joined a motley collection of contributors with a broad range of backgrounds who all answered an interesting array of questions. If you’re unlucky enough to work in one of those organisations that’s still debating the relative merits of DevOps then I think this little article gives a nice concise summary of the current state of the industry.
Standardisation
Since I started shamelessly self-promoting my DevOps prowess I’ve been asked to contribute to a few of these things. There’s usually one question that really piques my interest and gets me thinking. In this piece it was the question:
“Do you think DevOps will become more standardized?”
Software Fragmentation
As this piece was sponsored by AppDynamics I initially started thinking about software and services. In the early days of the DevOps movement there was a real danger that it would get written off as merely Continuous Integration. That focus spawned a plethora of software and plug-ins. Then when the #Monitoringsucks movement gained momentum it heralded a wealth of new approaches to monitoring tools and solutions, Outlyer (formerly known as Dataloop.IO) started in earnest, Datadog and the Application Performance Management tools started to really gain in popularity. Splunk and ELK become the standards for log-processing. All throughout this period various Cloud solutions launched. Redhat integrated various open-source solutions into an entire private cloud solution together which it put forward as a competitor to VMWare.
I was just putting an answer together about how at the start of major new trends in IT there’s always a profusion of software solutions around as organisations try to capitalise on all the press attention and hype when it occurred to me that the approach organisations have taken to adopt DevOps practices have become highly standardised.
Regardless of the exact mix of software and cloud solutions we always try to automate the building, testing and deployment (and more testing) of software onto automatically provisioned and configured infrastructure (with yet more testing). What has varied over the years is the precise mix of open and closed source software and the amount of in-house software and configuration required.
1st Generation
In the beginning before Patrick DuBois first coined the term DevOps Google, Facebook and Amazon all had to create automated build, configuration, deployment and test solutions to support their meteoric growth. Facebook had to create their own database software and deployment solutions. Amazon ended up building the first cloud solution to support the growth of their ecommerce site. Google had to create programming languages, frameworks and container ecosystems.
2nd Generation
The second generation of DevOps organisations including Netflix and Etsy were the first generation to be able to piece together pre-existing solutions built around CI tools like Jenkins and Teamcity to build their DevOps approaches. That’s not to say they didn’t have to build a lot of software, they did but Netflix were able to build on top of Amazon’s Cloud and Etsy relied on Jenkins and Elasticsearch among other tools. In technology circles Netflix are as famous for their codebase as they are for their video-on-demand service. While Etsy are perhaps a little less famous for their code their contributions are arguably much more influential. Where would we be without Statsd? Etsy’s Deployinator was responsible for driving a lot of the conversation about continuous integration in the early days of DevOps.
3rd Generation
I think we’re getting towards the end of the 3rd generation of DevOps. The current approach to abstracts us even further away from the hardware. It’s built on the concepts of containerisation, microservices and serverless functions. We’re trying to build immutable services, very rapidly deployed and automatically orchestrated. The goal is to support the most rapid test and deployment cycle possible, to minimise the need for separate functional and integration test cycles, to make the most efficient use of resources and allow us to scale very rapidly to meet burst demand. The software we’re forced to build at this point tends to be integration software to make one solution work with another and expose the results for analysis. Rather than building our solutions around CI tools we’re building them around orchestration mechanisms. We still need the CI tools but their capabilities aren’t the limiting factor anymore.
4th Generation
I think the next generation of DevOps will bring data management and presentation under control. Too often we choose the wrong data stores for the types of data we’re storing and the access patterns. There’s still a tendency to confuse production data stores with business intelligence use-cases. We’re still putting too much business logic in databases forcing us to run large data structure updates and migrations. We also need to lose the idea that storage is expensive and that everything must be immediately consistent, we also need to manage data like we do software in smaller independant files.
Standards
From the perspective of the daily lives of engineers and their workflows DevOps appears highly standardised. We haven’t standardised around a small number of software solutions that define how we work as previous generations of engineers did we have standardised our workflow. We’ve been able to do that thanks to the open source movement which has given us so many flexible solutions and made it easier for us to contribute to those solutions.
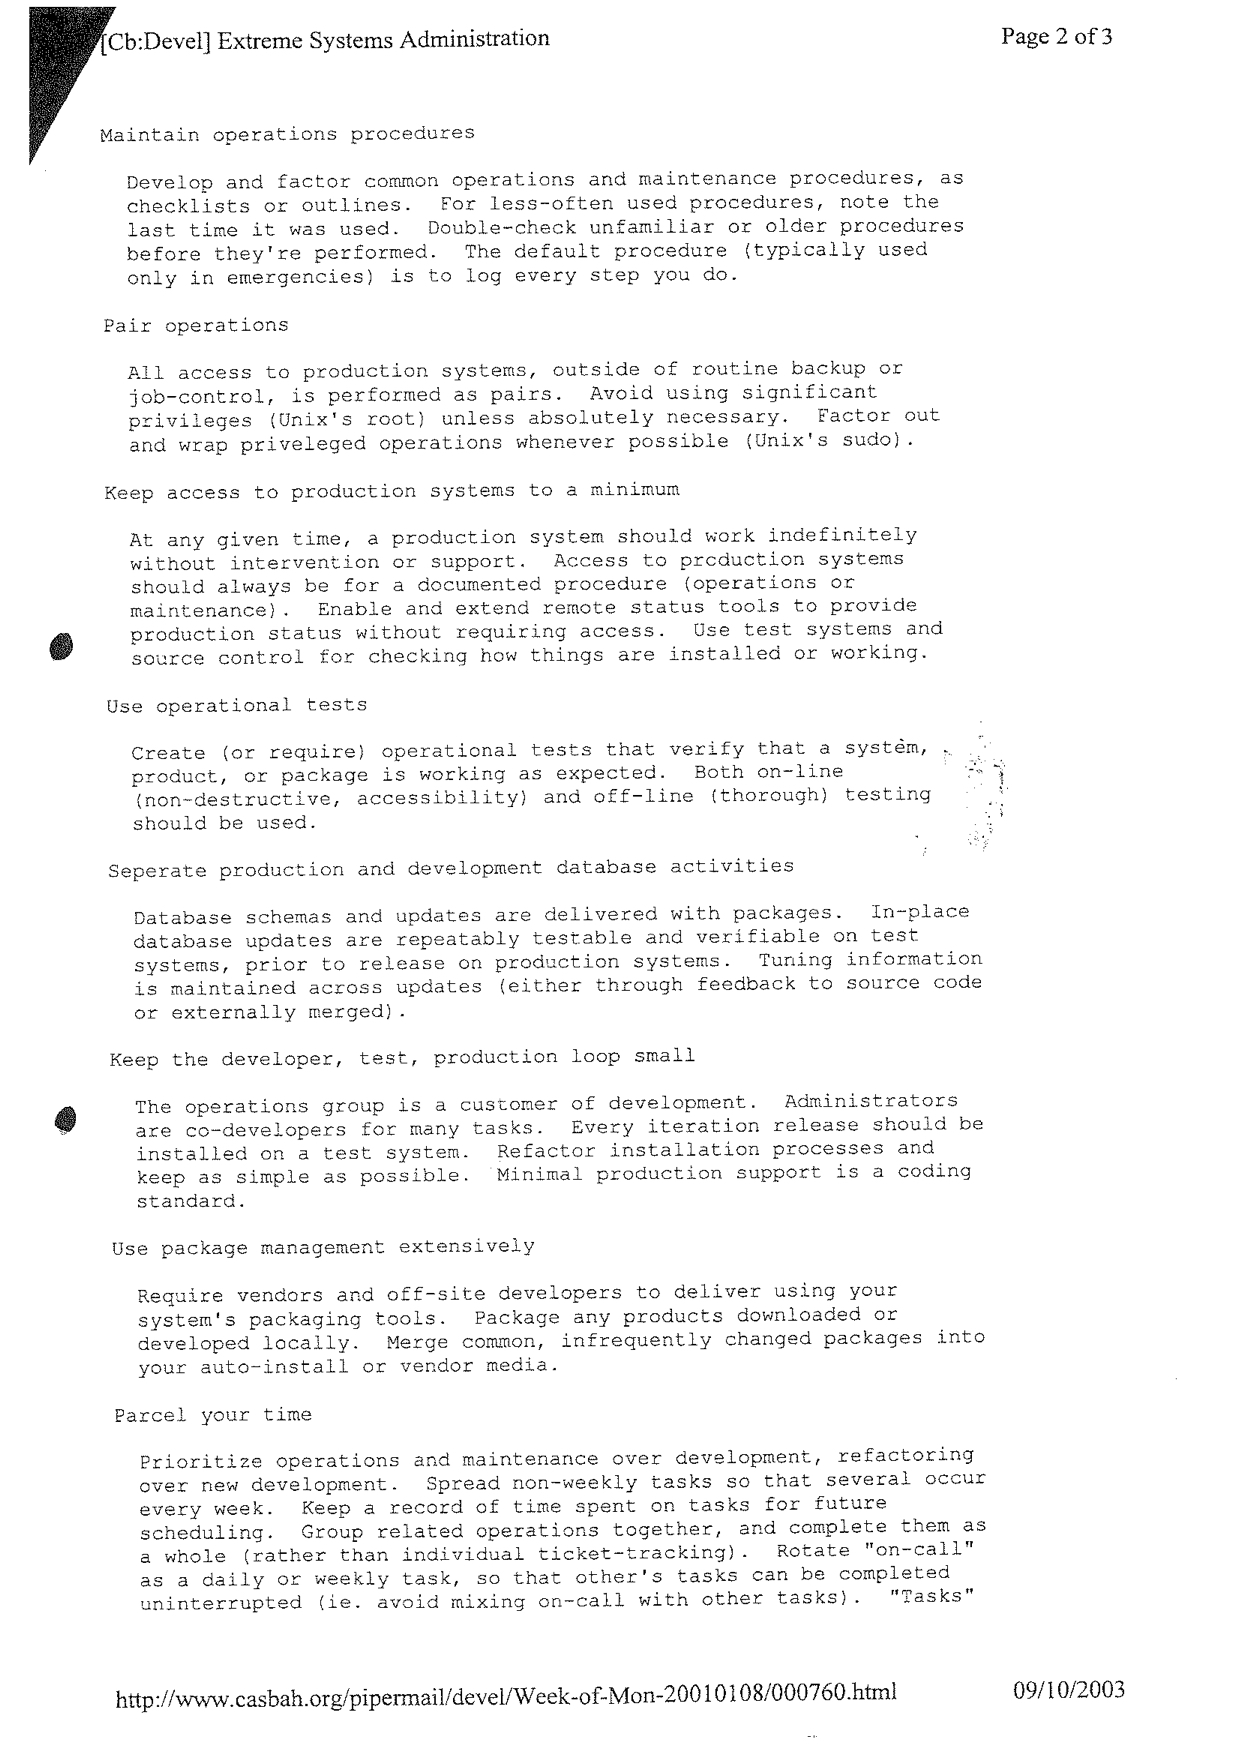
I’m often asked about my super-hero origin story. Everyone has one they’re not all as interesting as Superman’s baby crash landing on a farm prologue. My journey to DevOps started way back in my CompuServe days with my boss’ insistence that everything be scripted and automated. But another start point is the PDF I’ve included below.
I’ve written before about how AOL embraced Agile and had Thoughtworks help our development teams. I’ve also mentioned that the Ops team (my team) and the test team were left to fend for ourselves and figure out what Agile meant to us. One of the way I did that is with the excellent post below. I have failed to find a link to it on the internet hence presenting it in this format here. If anyone knows Ken Macleod from below please thank him from me. My thanks have already been given to the guy in my team who found this document. 14 years on it still makes excellent reading. Enjoy:
If you’d like the PDF complete with my scribbles from 2003 you can download it here: Extreme_Sys_admin
Dune, by Frank Herbert, is an amazing book and an equally amazing David Lynch movie. It’s also a phenomenal management book and contains some valuable wisdom that we can apply to DevOps.
In this article I’m going to pull out various quotes and thoughts from the characters in Dune and share with you some of the lessons I’ve taken from them.
One of the most powerful lessons I learned from Dune comes about halfway through the book. Just before a pivotal moment in the story, the lead character, Paul Atriedes’, reflects:
“Everything around him moved smoothly in the ancient routine that required no order.
‘Give as few orders as possible,’ his father had told him … once … long ago. ‘Once you’ve given orders on a subject, you must always give orders on that subject.’”
As a leader this advice has been invaluable to me. A team that understands the values of it’s leader and the behaviour he or she expects from them far outperforms a team who are given constant instruction and supervision.
Not only does this hold true for managing teams but also for DevOps. When infrastructure is considered as individual machines that need care and maintenance it encourages us to give constant orders to them. Permit this person to issue this command, archive this log at this time, execute this command etc… Considering infrastructure as a system composed of identical nodes encourages us to create behaviours that the system as a whole conforms to. This is modern configuration management in a nutshell. Any nodes that don’t comply are simply replaced when they display behaviour out of the ordinary. This makes it easier to manage all the different environments the same way making application behaviour more predictable this then reduces the time spent diagnosing why problems occur in one environment and not another which in turn reduces the time needed to implement new features.
What Paul’s father, the Duke Leto Atriedes knew, was that people, whose loyalty he had earned, respected his values and wanted to work according to his values. What I’ve learned is that systems whose behaviour is managed are more reliable and require considerably less maintenance than systems that are poked and prodded at.
Dune even goes so far as to offer us DevOps axioms:
Earlier in the book Paul is being tested by one of his mother’s teachers and she tells him:
“In politics, the tripod is the most unstable of all structures.”
She’s referring to the major structures of government that make up the world of Dune.
However there’s a lesson for us in Technology here too. The three great competing forces in a typical technology department are Development, Operations and Testing. Just as in Dune there can be no stable and productive arrangement of these three groups.
Development are incentivised to change and grow capability. Testing are at the whim of development but are often underfunded and unloved. Operations are incentivised by stability and predictability and often find take a cautious position that plays well to the needs of a test team always looking for more time. If testing receives funding then they form a power block with Development which besieges operations. So there can never be a stable productive accord between these three groups… While they remain three divided groups.
The lesson for us here is to not create these three structures in the first place or to break down the silos that constrain them if we have them. By creating product-centric service teams comprised of engineers from all the essential disciplines the team will have all the skills they need to build, launch, manage and support their service. This new type of team is motivated by the performance of their service not merely it’s infrastructure, it’s code or it’s conformance to predefined criteria.
There’s also some great practical advice for troubleshooting scaling problems. Early in the book Paul quotes the first law of Mentat. In Dune Mentat’s are human computers capable of processing data at incredible rates. The first law of Mental states:
“A process cannot be understood by stopping it. Understanding must move with the flow of the process, must join it and flow with it.”
Consider the data most technical teams have for troubleshooting. System metrics, log entries, transaction checkpoints. All static data indicating a single point in time and in this data we’re supposed to understand how processes are behaving. Now consider what happens when we collect, aggregate and trend this data over time and review states prior to, during and after incidents. We begin to truly understand process behaviour and the behaviour of the various systems those processes operate within. Now to be fair the Application Performance Management tools took this as their goal from the outset but these tools have only been around for a few years now and many organisations are still not investing properly in their monitoring services.
I’d like to leave you with one final message from Dune:
“Survival is the ability to swim in strange water.”
The water we swim in these days has become very strange. Applications have become services, services are comprised of micro-services, these services might run on platform services or infrastructure services that are themselves dependant on other services. We need DevOps if we’re going to survive in these strange waters.
On July 10th at the Park Plaza County Hall in London I had the opportunity to speak at the DevOps Enthusiast event organised by Arrows Group. First of all I’d like to thank Arrows Group for organising such a great a event. This was the first time that the ideas that form the backbone of my new book: Next Gen DevOps: Creating the DevOps Organisation would be heard by the public.
Thanks to my Dad for videoing the event! I was presented with some excellent questions which I’ll upload in the coming weeks. The presentation is just over 20 minutes long. If that’s just too much commitment then you can skip ahead to 21:05 for the summary. Enjoy!


 Dune, by Frank Herbert, is an amazing book and an equally amazing David Lynch movie. It’s also a phenomenal management book and contains some valuable wisdom that we can apply to DevOps.